Intelligent Driver Assistance Services Map
Our services provide data that helps to increase safety and comfort of all levels of assisted and automated driving. You can use our driver assistance services map to get an idea which data we provide and get a better understanding what the data means in detail. All you need is an active user account and then you are ready to go. Just go to the Sign-in/up page and create your account or use your existing developer portal account.
Services
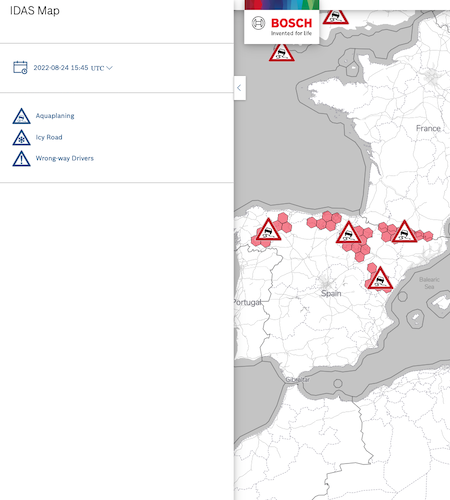
The map consists of a variety of data provided by our services. It includes data coming from vehicles and warnings that exists in a particular area. Our data coverage includes Europe, North America and Japan.
The data corresponds to the timestamp in UTC that is selected. If only specific services are for interest, it is possible to toggle the visibility of the service data through clicking on the single service items within the sidebar.

Detected wrong-way driver caused by crossing highway ramp in wrong direction.

Slippery road warning caused by freezing wetness, black-ice, snow or ice-rain.

Aquaplaning warning caused by a certain amount of waterfilm thickness on the road.
Representation
For the visualisation of the warnings in a particular area, a hexagon grid is used. Depending on the zoom level the hexagons will adapt their sizes to different resolutions with specific edge lengths. Because of the curvature of the earth the hexagons are not exactly the same size and here are only the average values given. The traffic sign on top of the hexagons shows the type of warning in this area.
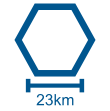
Hexagon with an edge length of 23km.
Data
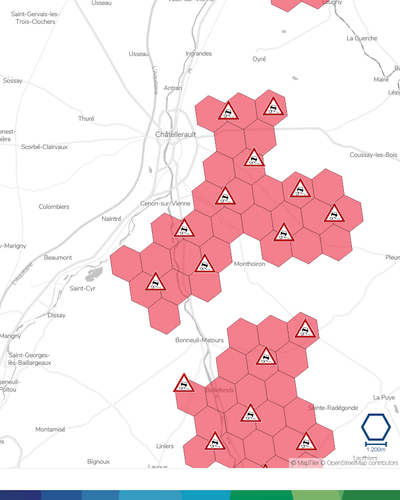
The warnings are expressed in a level of risk in percentage. In customer projects, Bosch shares a more sophisticated risk level proposal when the warning should be triggered. But this level can always be adapted by the customer. You can also see the total amount of road kilometers affected by warnings.
Additionally to the road warnings, the numbers of trips and wrong-way drivers our service detected in a selected timestamp - 24h window are provided.
Besides the risk level, the corresponding friction value is calculated for a specific hexagon and shown with its history for the day.
All data that is shown is from one day before. The time can be set on your own. If you want to get more insights into our data, feel free to contact us.
If you want to give some feedback or have questions about the map, feel free to use the feedback button below. We are looking forward to hear something from you!